The SIMPIPE SUITE program is a platform for pipeline engineering solutions with modules for:
All data and calculated results have version control and can be stored and visualized in graphs, tables and georeferenced maps in its own visualization format.
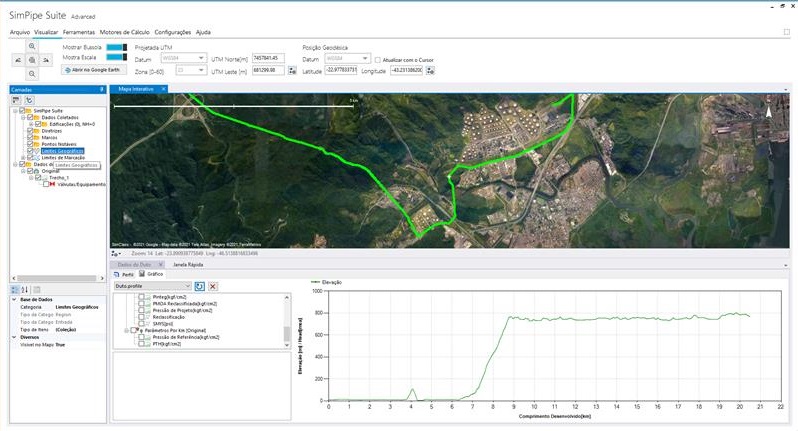
SIMPIPE SUITE contains a graphical interface with visualization, navigation, database editing in UTM projected coordinates (east, north, elevation, zone and horizontal datum) or geodesic (latitude, longitude, geocentric datum) and has iterative actions with own and public satellite images (Google Maps, Bing, WikiMaps, and other WMS providers).
The program has a local database in XML format, and allows the integration and manipulation of input data from spreadsheets and import of KML (Google Earth) and ShapeFile (ESRI ArcGis) files.
Obtain a Viewing License effortlessly through the Customer Portal. Register, download the software, and start using it right away.
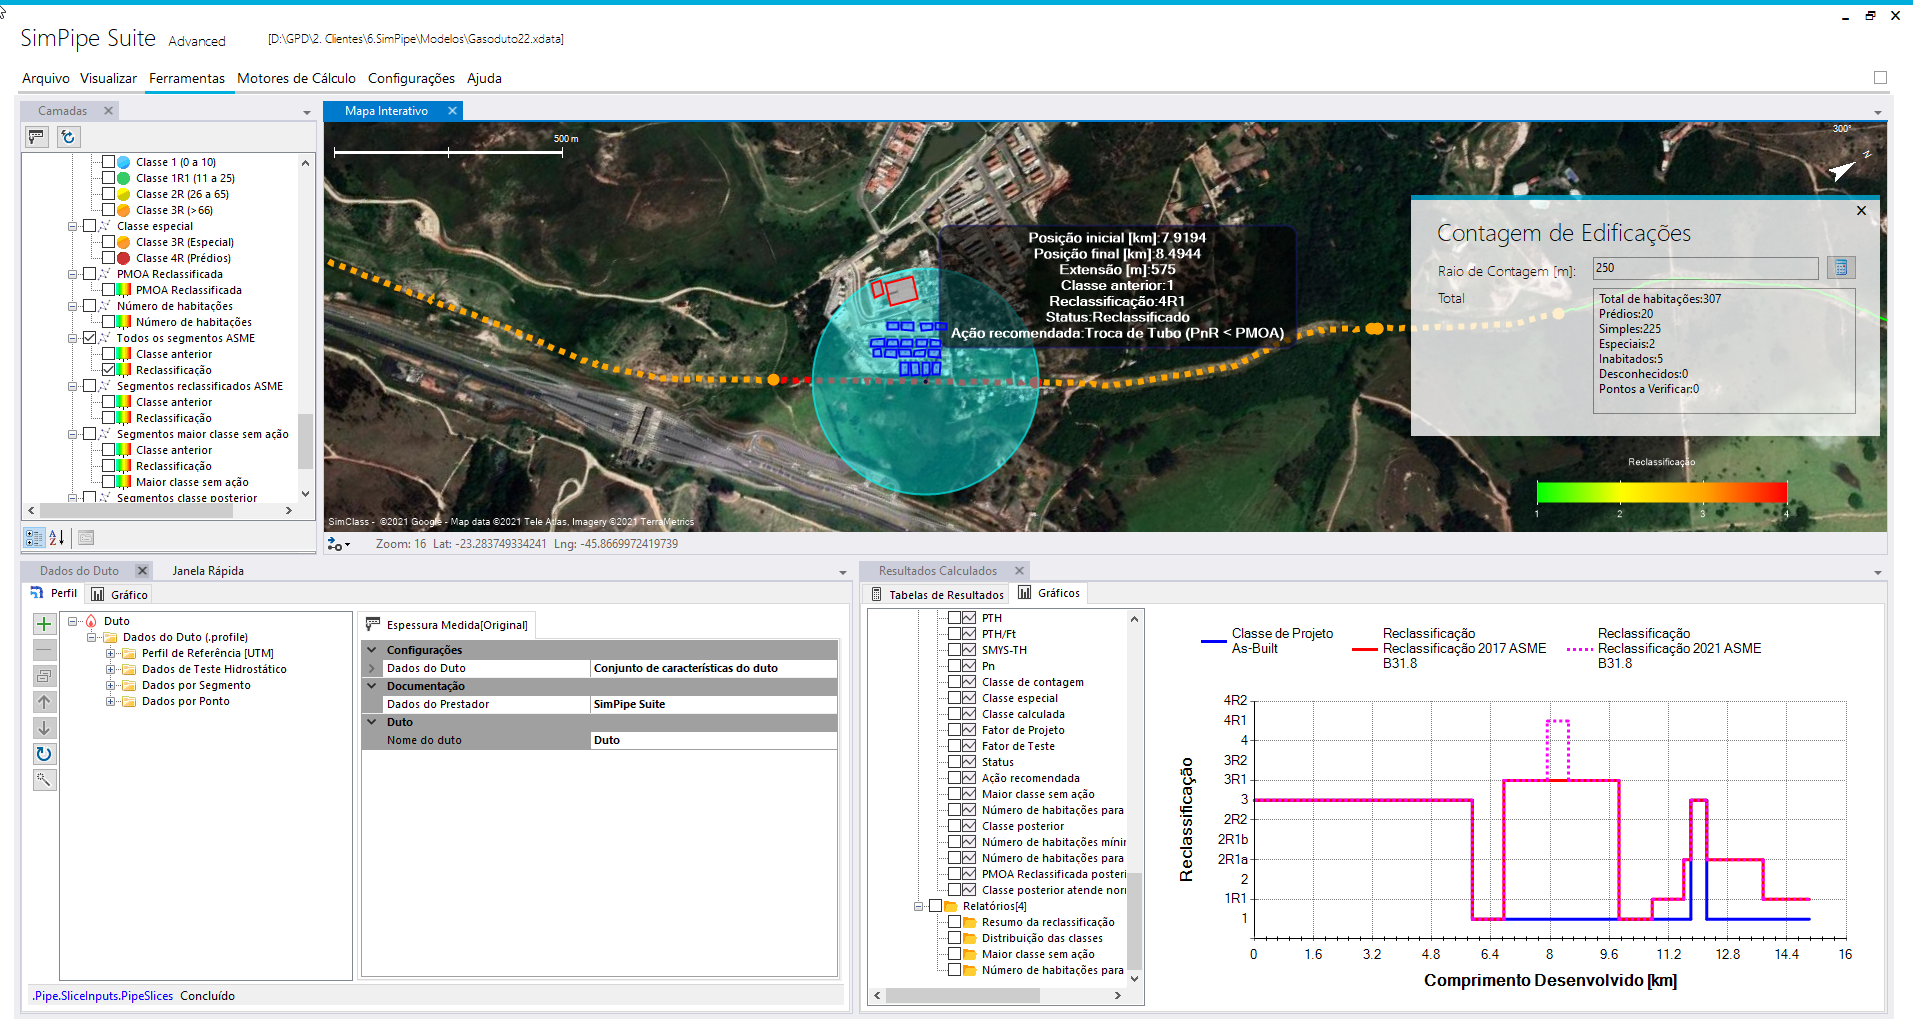
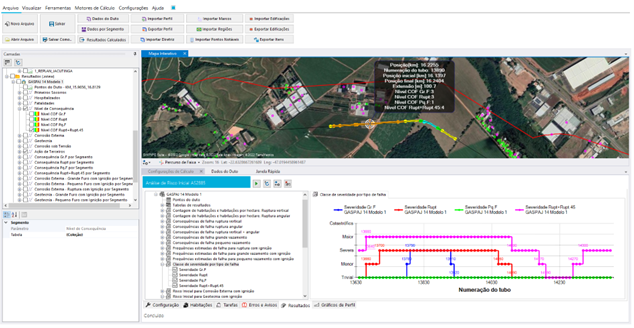
SIMCLASS that supports the changes in location class assessments mainly promoted by third-party influence near the pipeline. The SIMCLASS solver considers the number of dwelling units, building type (simple, multistore, special or no-human occupancy) and its localization to evaluate the current location class using a moving mile algorithm, and consolidates segments to determines the changes in location class and new gas pipeline according to international pipeline standards (ASME B31.8 and ISO-13623) and Brazilian Standards Petrobras N-2775.
The SIMCLASS main features are listed below:
For more information
The SIMDATA module performs the calculation and management of the Maximum Allowable Operating Pressure (MAOP) for international standards: ASME B 31.8, ISO 13.623, ASME B 31.4 and Brazilian standards: NBR 15.280-1, NBR-12712 standards based on pipeline design data, inline inspection data (ILI), hydrostatic test data and change in class location for existing pipelines.
The main features of the SIMDATA module are presented below:
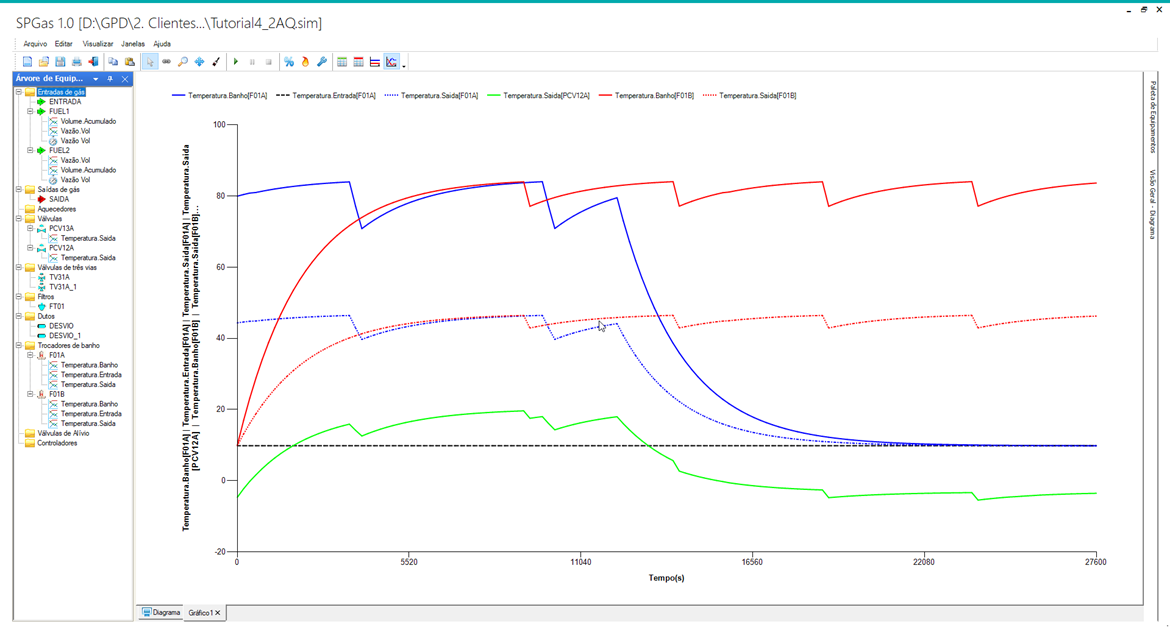
SIMPIPE has developed the SPGas tool that allows the modeling of a complete delivery point, with its different equipment. It is possible, from the reproduction of the current operating condition, to create scenarios for operational improvement through the implementation of different types of control. It can also be used for training the team involved in the design, operation and maintenance stages of the delivery points, improving knowledge of the operation of equipment and process variables. It is possible to analyze the operating conditions of the various modules of a delivery point, such as filtering, heating, pressure reduction, metering and utilities module.
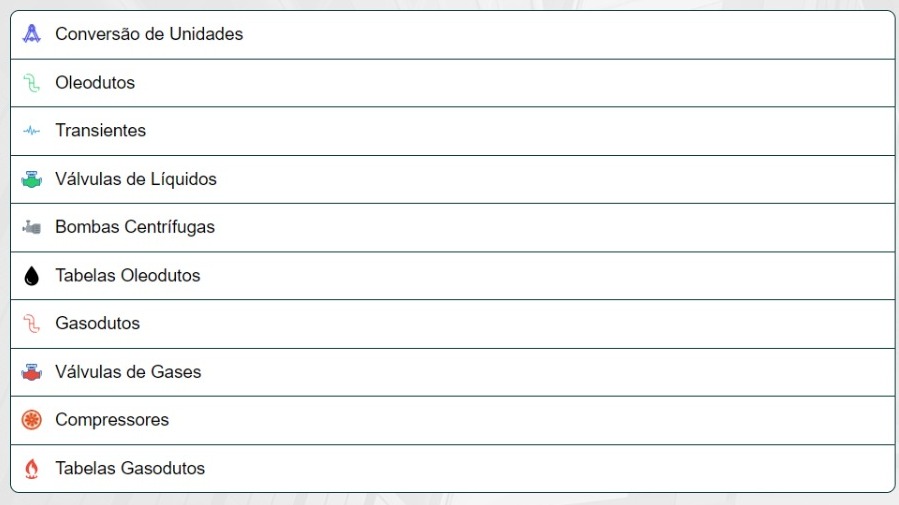
SIMPIPE TOOLS is a web tool for the pipeline community with calculations and data for quick reference.
In addition to unit conversion, there are also calculations of pressure drop, water hammer, valve flow coefficient, normative data, etc.
Go to tools.simpipe.com and register to guarantee your free access!
The SIMRISK AS 2885 is used for the development of risk analysis studies focused on reclassification, based on the Australian standard AS 2885.
The main characteristics of the module are:
- Calculation of maximum mass flow and energy released for spills with ignition;
- Calculation of the thermal radiation contour radius;
- Calculation of the critical defect length (CDL);
- Calculation of force and penetration resistance.
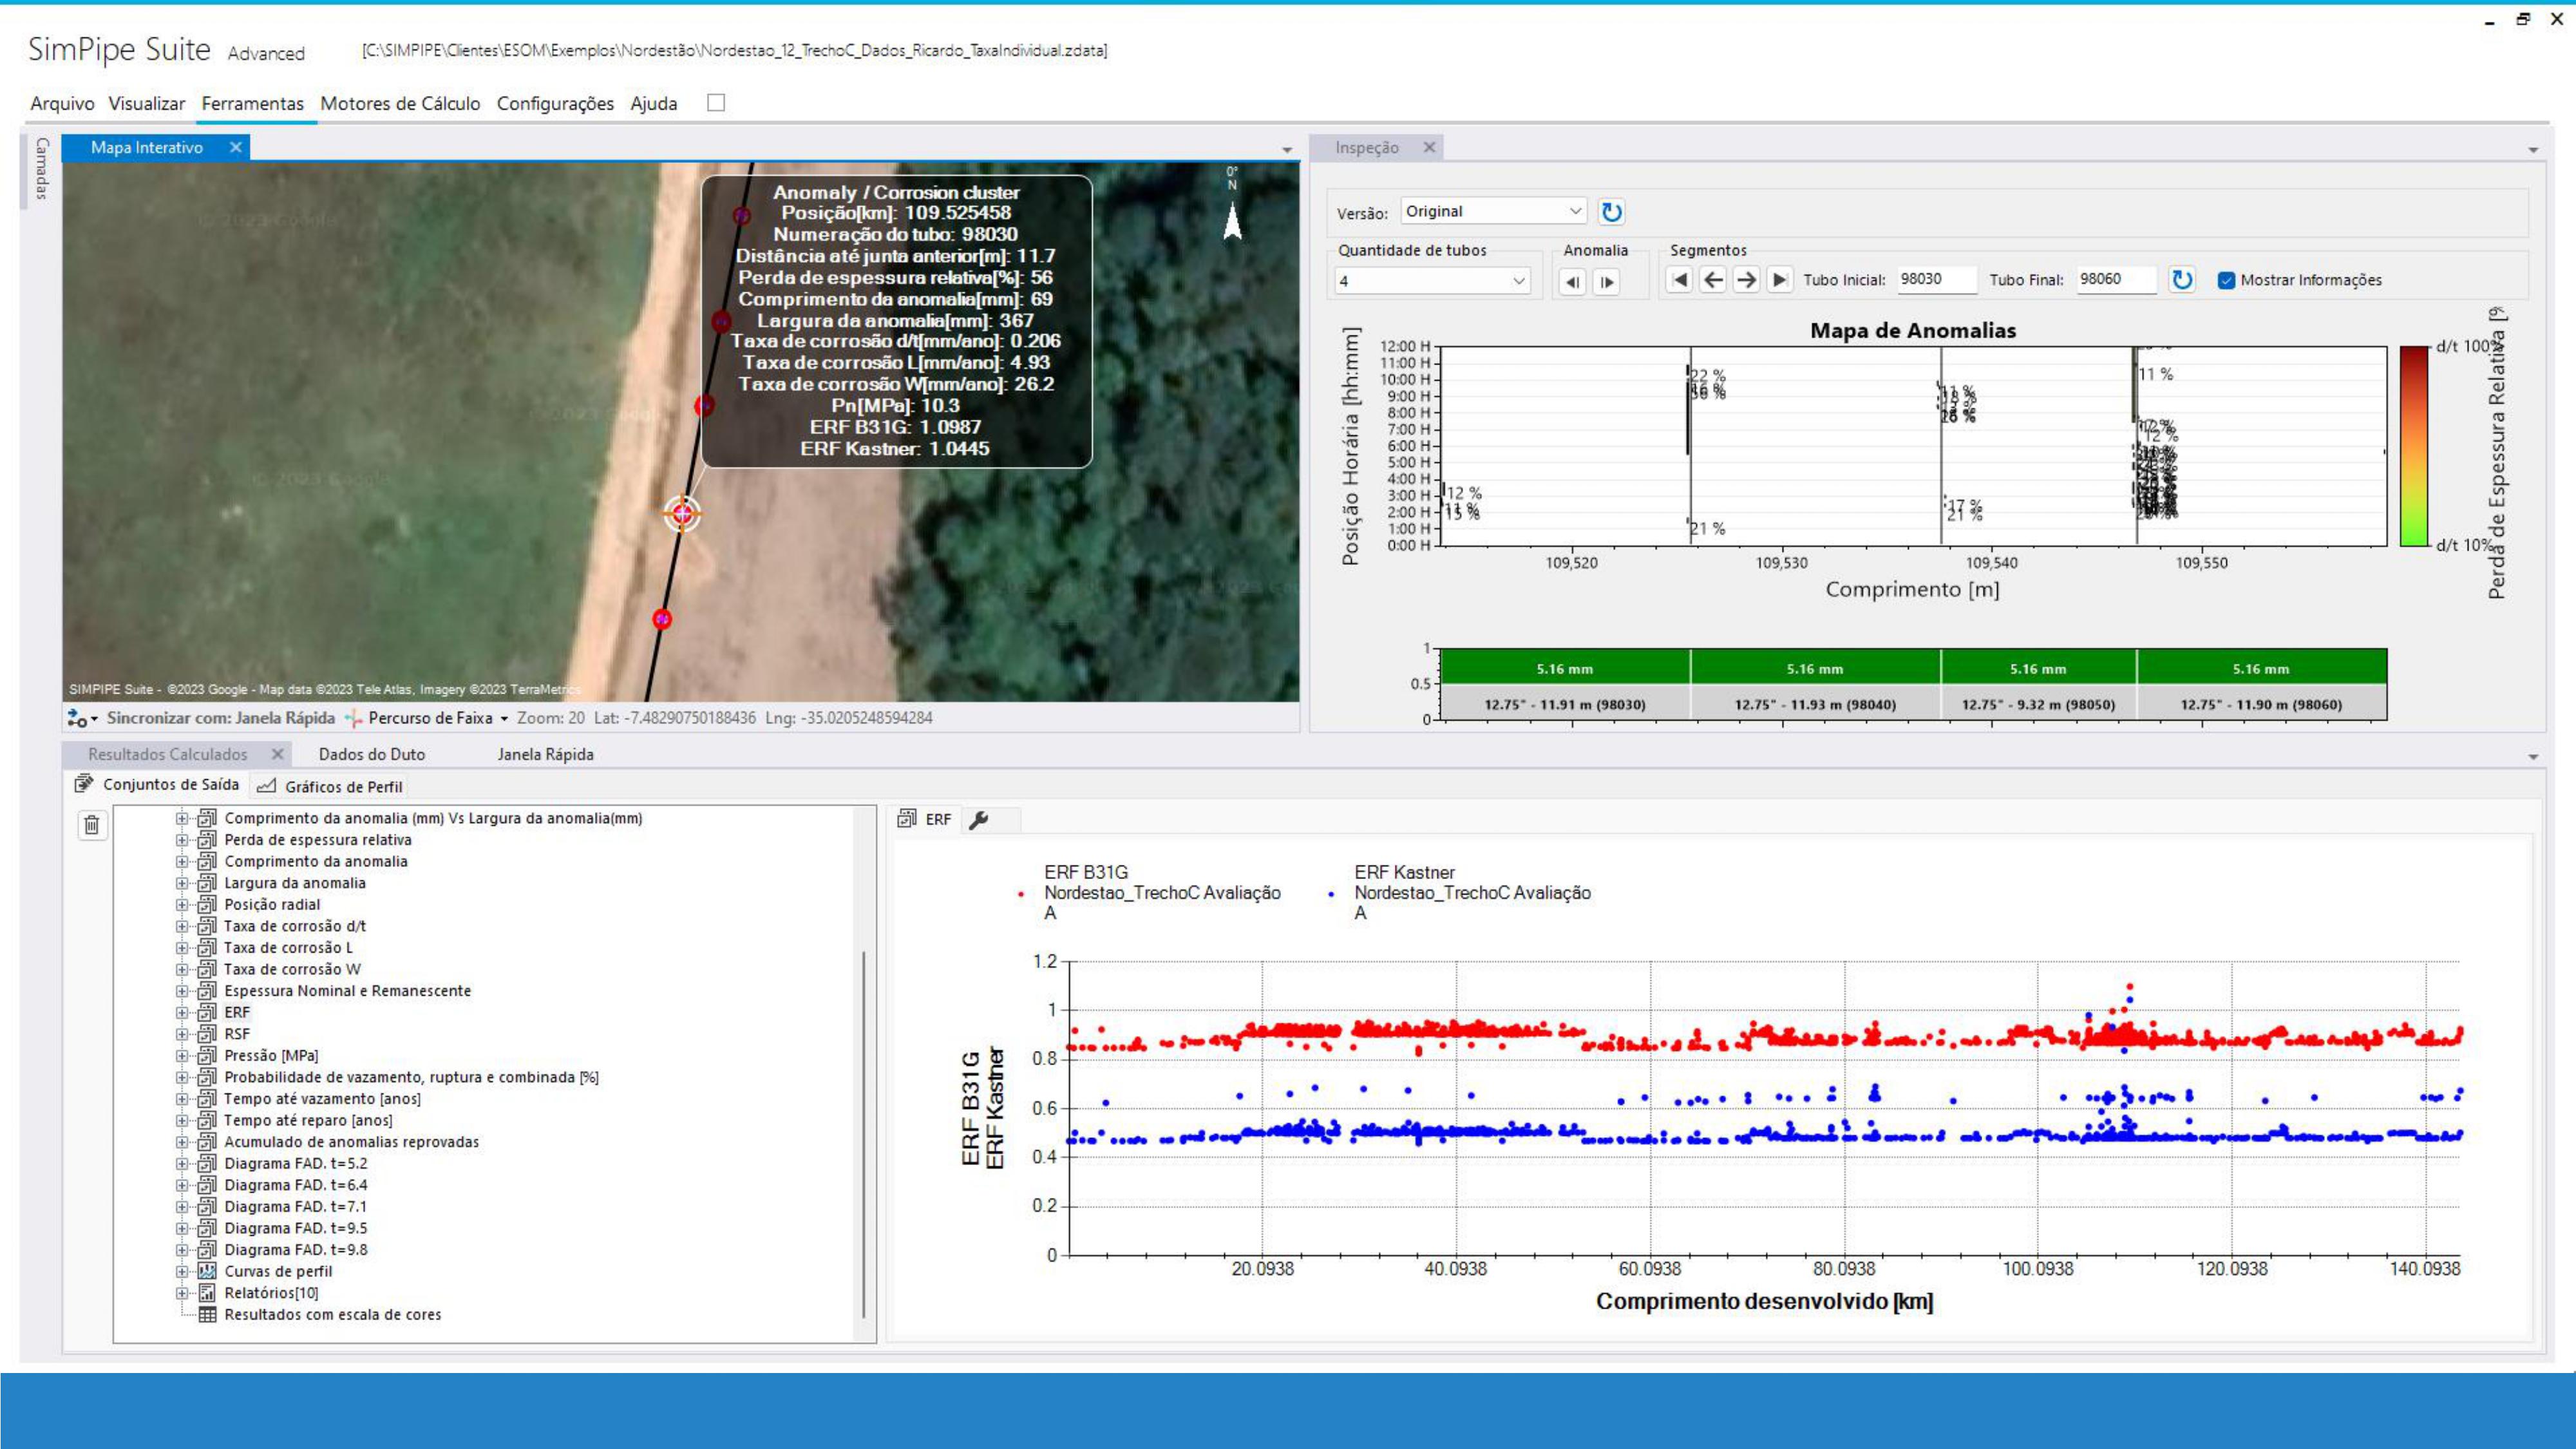
- POF rating
- Thickness loss histogram
- ERF Histogram
- Profiles of loss of thickness (d/t), length (L) and width (W) of anomaly
- Radial position profile along the duct
- Corrosion rate profiles d/t, L and W
- ERF and RSF profiles by criteria
- Permissible and failure pressure profile
- Time to leak and time to repair
- Ranking of Anomalies (greater loss or greater ERF)
- FAD diagram
- Forecast of repairs
- Accumulation of failed anomalies
- Customizable Word report export
Avenida Rio Branco, 131 - sala 801 - Centro | Rio de Janeiro, RJ, Brasil | CEP 20040-006
![]() +55 21 98885-1491
+55 21 98885-1491
![]() +55 21 3557-0033
+55 21 3557-0033![]() simpipe@simpipe.com
simpipe@simpipe.com
